If you’ve attempted to do any analysis in GA4, I expect at least once, you’ve been scratching your head on why the data looks very different to UA or just doesn’t make any sense. Rest assured, you’re not alone. Even the GA4 experts haven’t always got the answers...but read on to find out what we do know…
UA sunsetting has been looming over our heads for the past few years. Whilst not all properties went dark on 1st July 2023 as expected, no doubt many are now finding that their UA data has flatlined. Therefore, hopefully you’ve already got a GA4 property collecting data, but now (unlike before) you’re forced to use its data and discover that things aren’t like they used to be (at all).
I fell in love with Google Analytics 10+ years ago…What made it so accessible to me was that no matter how I did my analysis, I would end up with the exact same report/numbers. A simple standard report would show the same data if I used Advanced Segments or BigQuery.
I would echo the words of Charles Farina. As someone who forensically analyses data like an accountant (the numbers are either right or wrong), the world of GA4 and its many data counts, for what seems like the same thing, is both infuriating and baffling.
Here are some of the fundamental differences (that we just can’t change) but also some of the mysteries that are yet to be solved which I thought you'd appreciate knowing in advance.
Click the links to jump to a section.
- Session counts differ
- Events don't show up in lists and reports
- Report filters are case sensitive
- Conversions can only be proactively registered if their event name doesn't contain spaces
- Conversions only count as conversions from the moment they're marked as one
- The GA4 UI doesn't actually tell you how many users visited your website
- Changing date ranges can change report views and data counts
- Don't check your results too early
Session counts differ
Usually the first thing people spot is the session counts between UA and GA4 are different. Sometimes it’s negligible, other times wildly different.
Since the two platforms collect and process data in different ways, and GA4 properties have more stringently had consent preferences applied, this is possibly of no surprise. Kudos to KS Digital for creating a helpful Looker dashboard to help compare the two platforms.
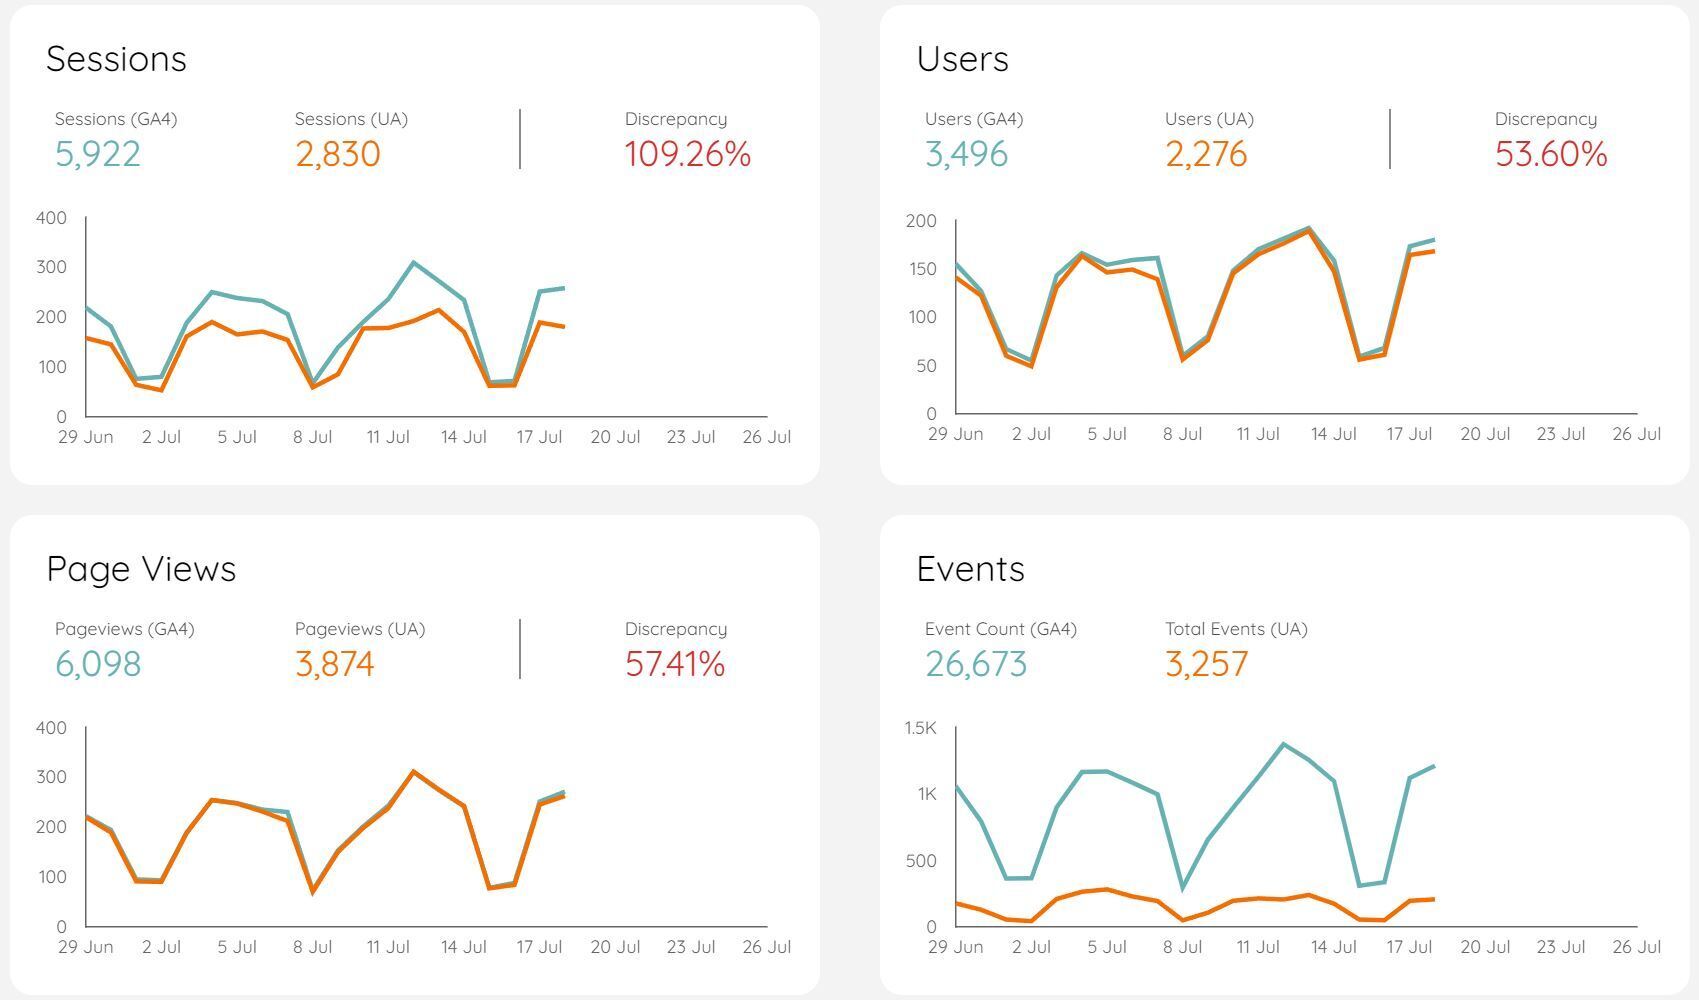
In this example there are wildly different session counts, user counts, pageviews and events. It would be understandable to jump to the conclusion that it’s the GA4 data which is incorrect, but it would be wise to check implementation to be sure that truly is the case.
For many properties we’ve seen, UA has actually been set-up incorrectly (especially with regards to pageview counts where multiple tags have been firing on the same page). So just because you’re used to seeing UA numbers, it doesn’t mean they were correct. You just didn’t know they might have been incorrect.
Sessions processed differently
Sessions are also treated differently in GA4 and the same action in both platforms can determine whether a new session is recorded or not in either platform. This is a good article to explain why there might be differences.
GA4 treats everything as an event, UA had types of hits
Remember GA4 is based solely on events, whilst UA had hit types (page hits, ecommerce hits, social interaction hits etc). This will be a big reason why the event count is so different.
GA4 property may be collecting data from more than one domain or sub domain
Best practice implementation of GA4’s measurement ID is to apply the same code across multiple domains and sub domains if they’re part of an inter-connected user journey. With UA you may have tagged these properties differently - for example: you had one UA ID for website.com, but a different ID for your blog.website.com.
GA4 data should roll all this information into one and at a top level reporting view you won’t distinguish between the two domain types, and thus you will be combining stats when you previously didn’t. To get a better like-for-like comparison make sure you filter by hostname.
That being said, large disparities in the data set should be investigated as there could be flaws in your GA4 configuration.
In the previously mentioned example, there was an issue in that every page view was considered a new session due to the way the consent management rules were being applied. So this needed fixing!
Events don’t show up in lists & reports
The events section in the admin panel is where you’d expect to find a full breakdown of all events tracked in your GA4 property, right? As soon as an event gets registered it should appear in this list, and if necessary you can mark it as a conversion.
However, we’ve noticed that sometimes events can be registered but they don’t show up in this view. We have no idea why! And it can be really annoying when you need to mark it as a conversion.
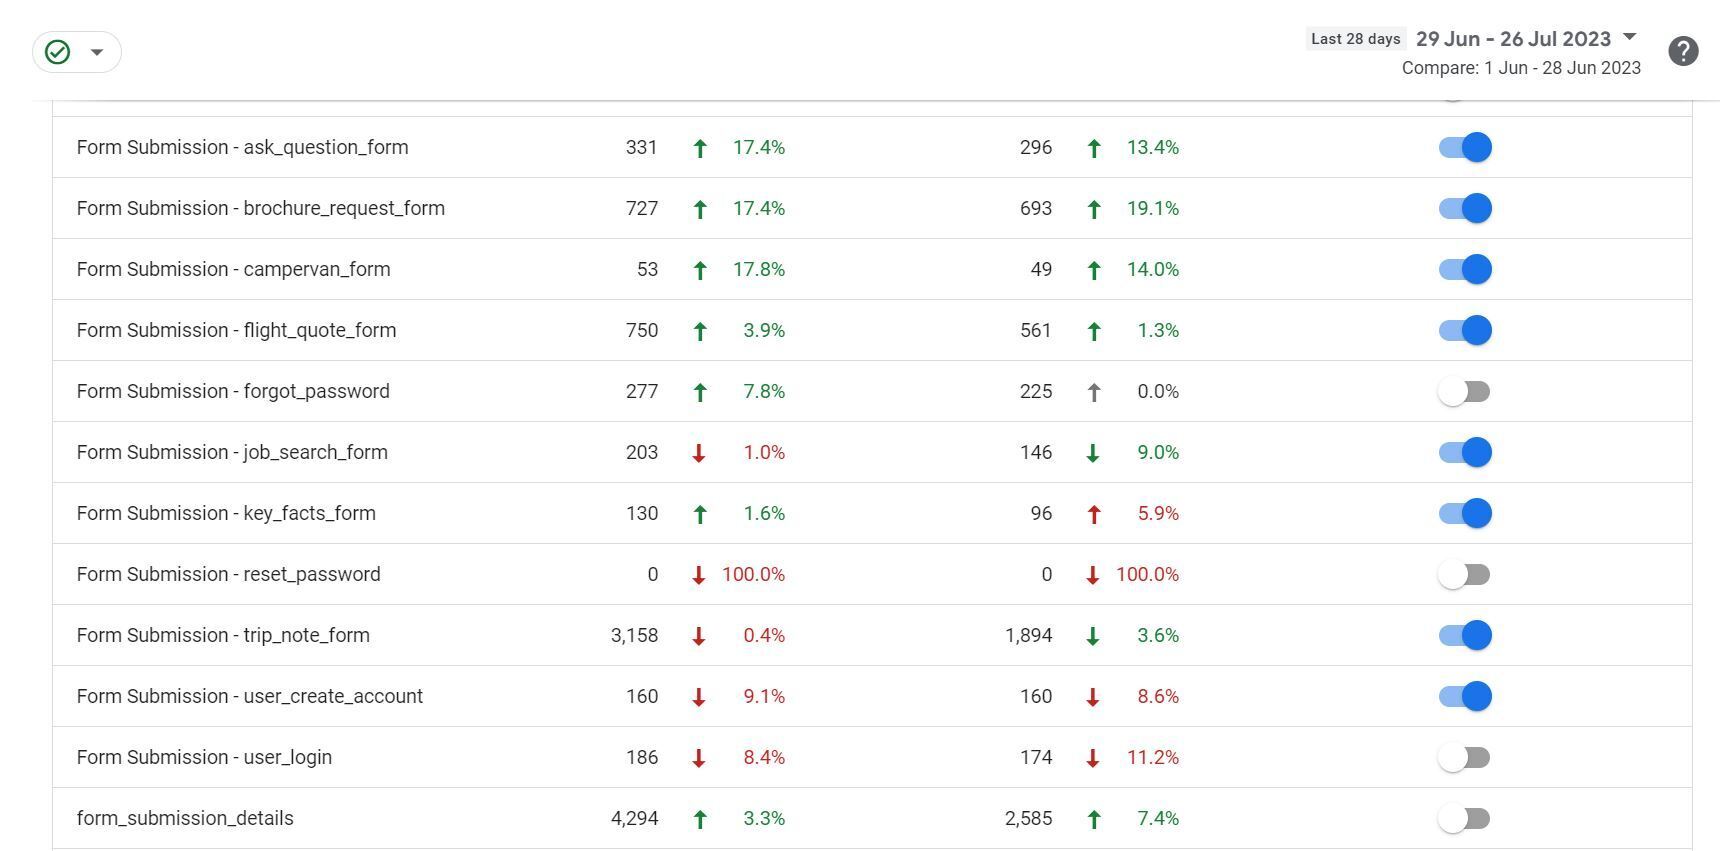
Registered event list
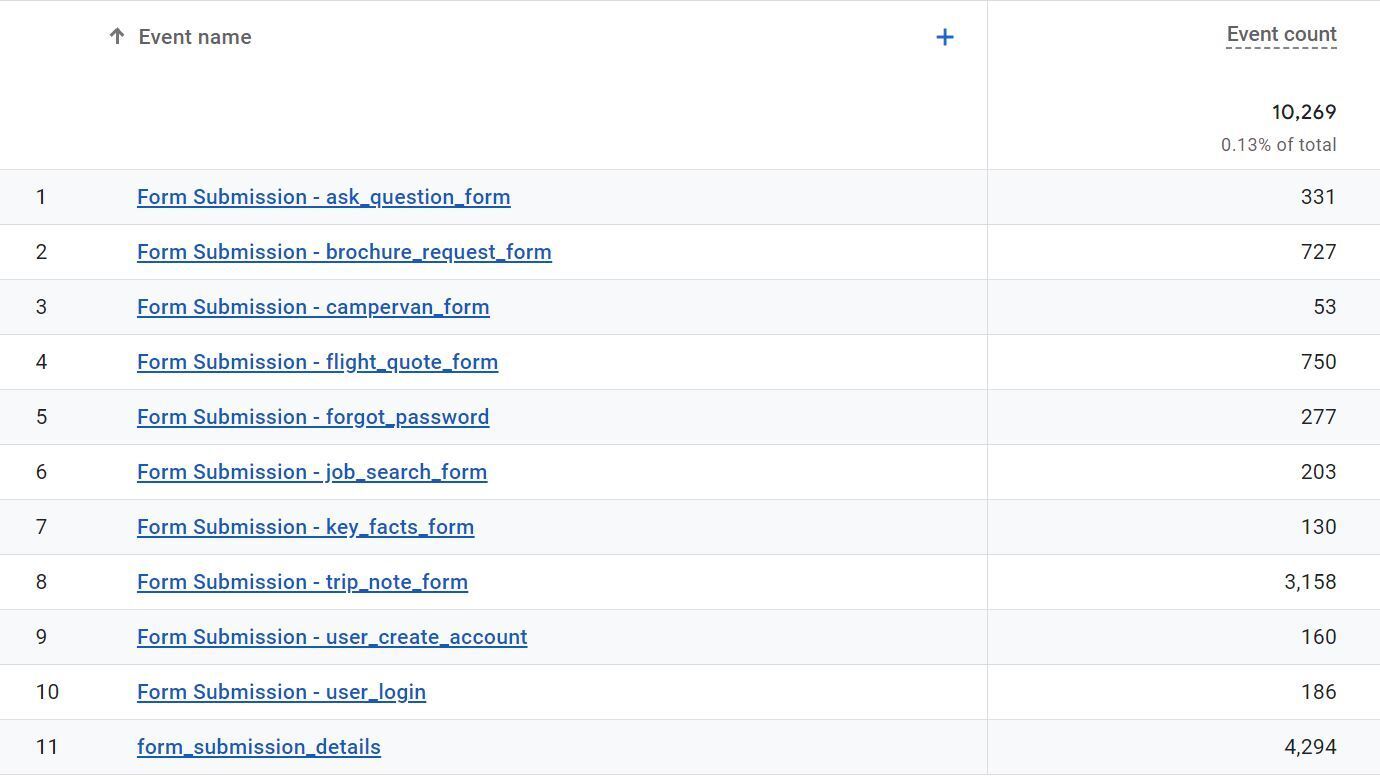
Event standard report
Event exploration report
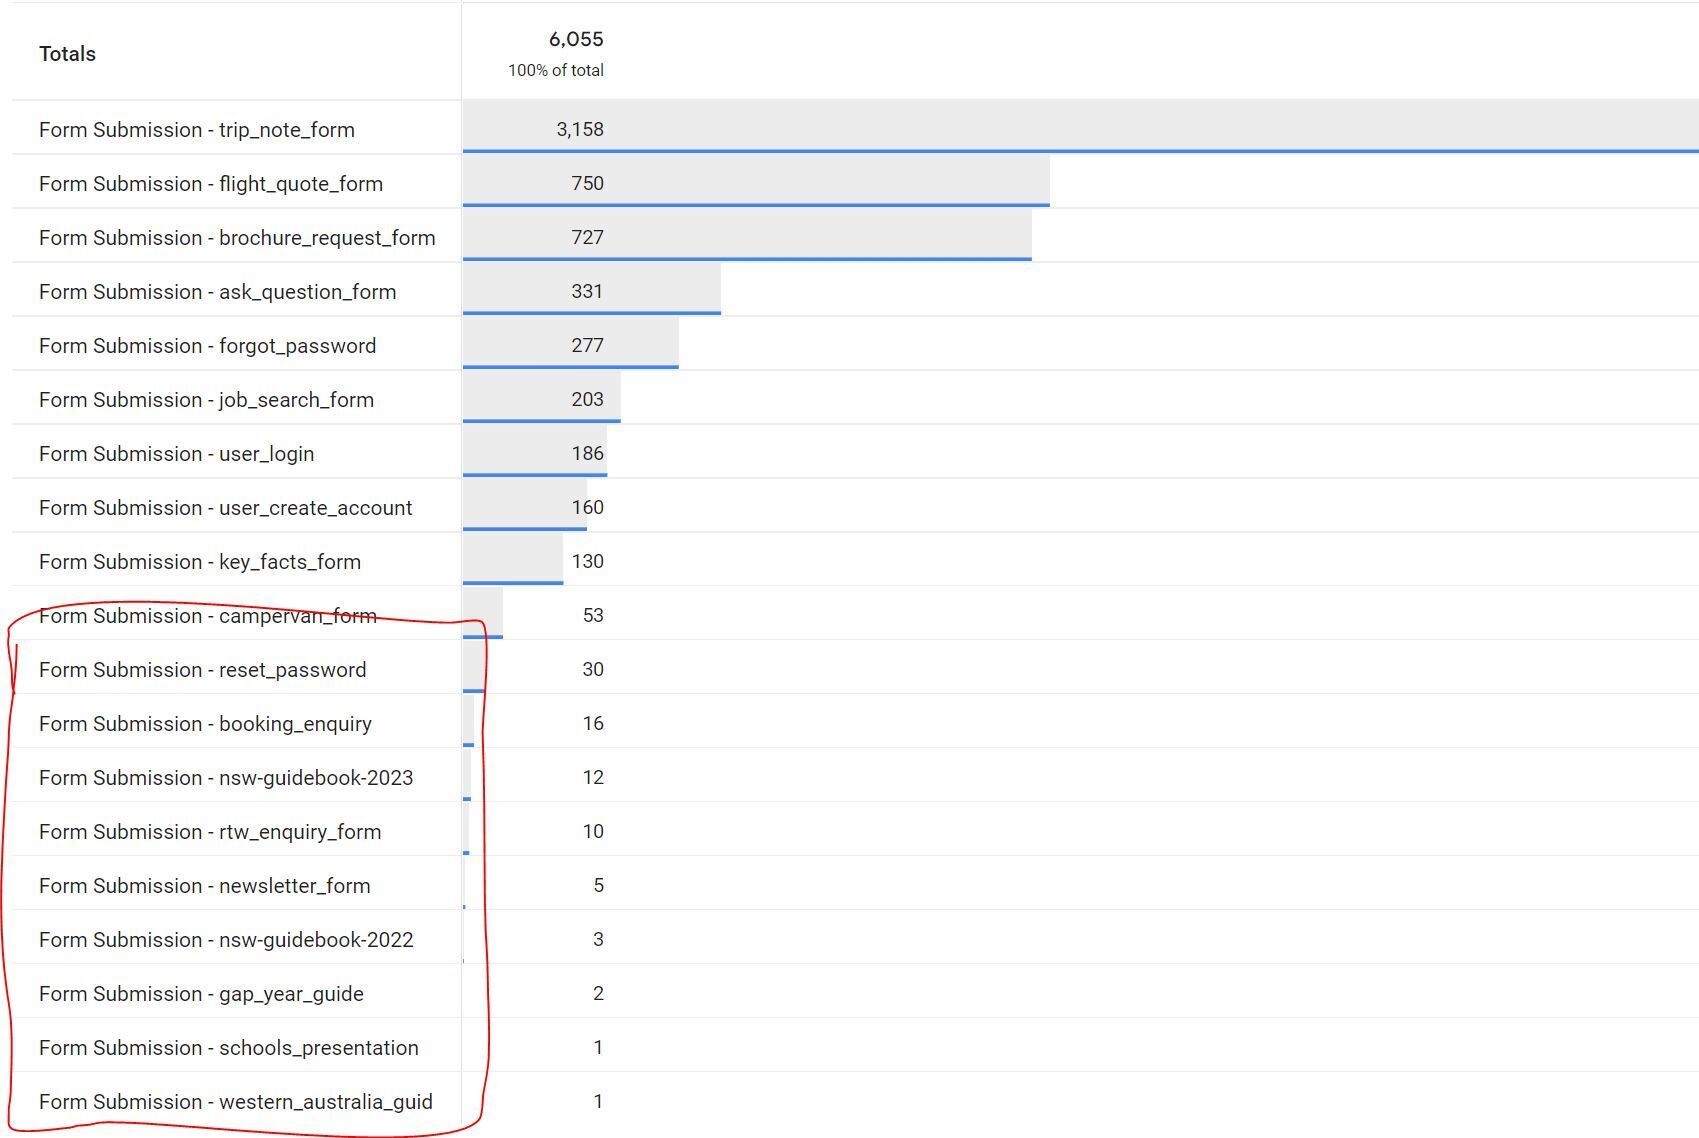
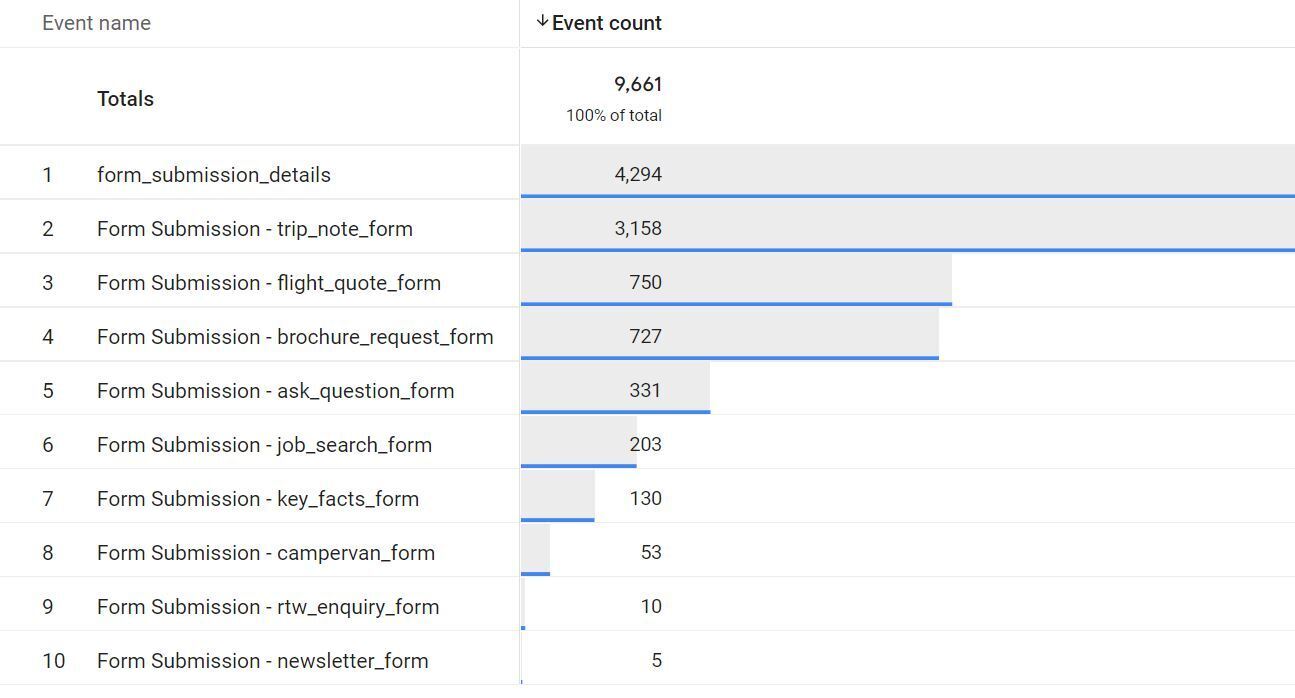
In this instance, all the events listed below a count of 53 aren’t shown in the event list or the standard report, but they do appear when you run an exploration report!
Report filters are also case sensitive!
To provide this example, I struggled to get all entries for form submission to show when I applied a filter for ‘form’ (only 10 entries). When I used ‘Form’ as the filter there were 19 instances - this is to do with how events are named - everything is case sensitive (argh!).
So beware when you’re filtering, if you have event names ‘all over the place’ you could miss important stats, or make the process to retrieve them more cumbersome.
Our best practice configuration for event names is to use:
- Lowercase only
- Only letters, numbers and underscores
- No spaces
Based on the report output this is even more important to do than we first thought.
Conversions can only now be proactively registered if they don’t contain spaces
Following on from the best practice configuration guide for event names, we’ve recently noticed that if you want to register an event name as a conversion (before the event appears in the event list) then you can’t do this if your event name contains a space.
This works…

but this doesn’t…

Conversions only count as conversions from the moment they’re marked as a one
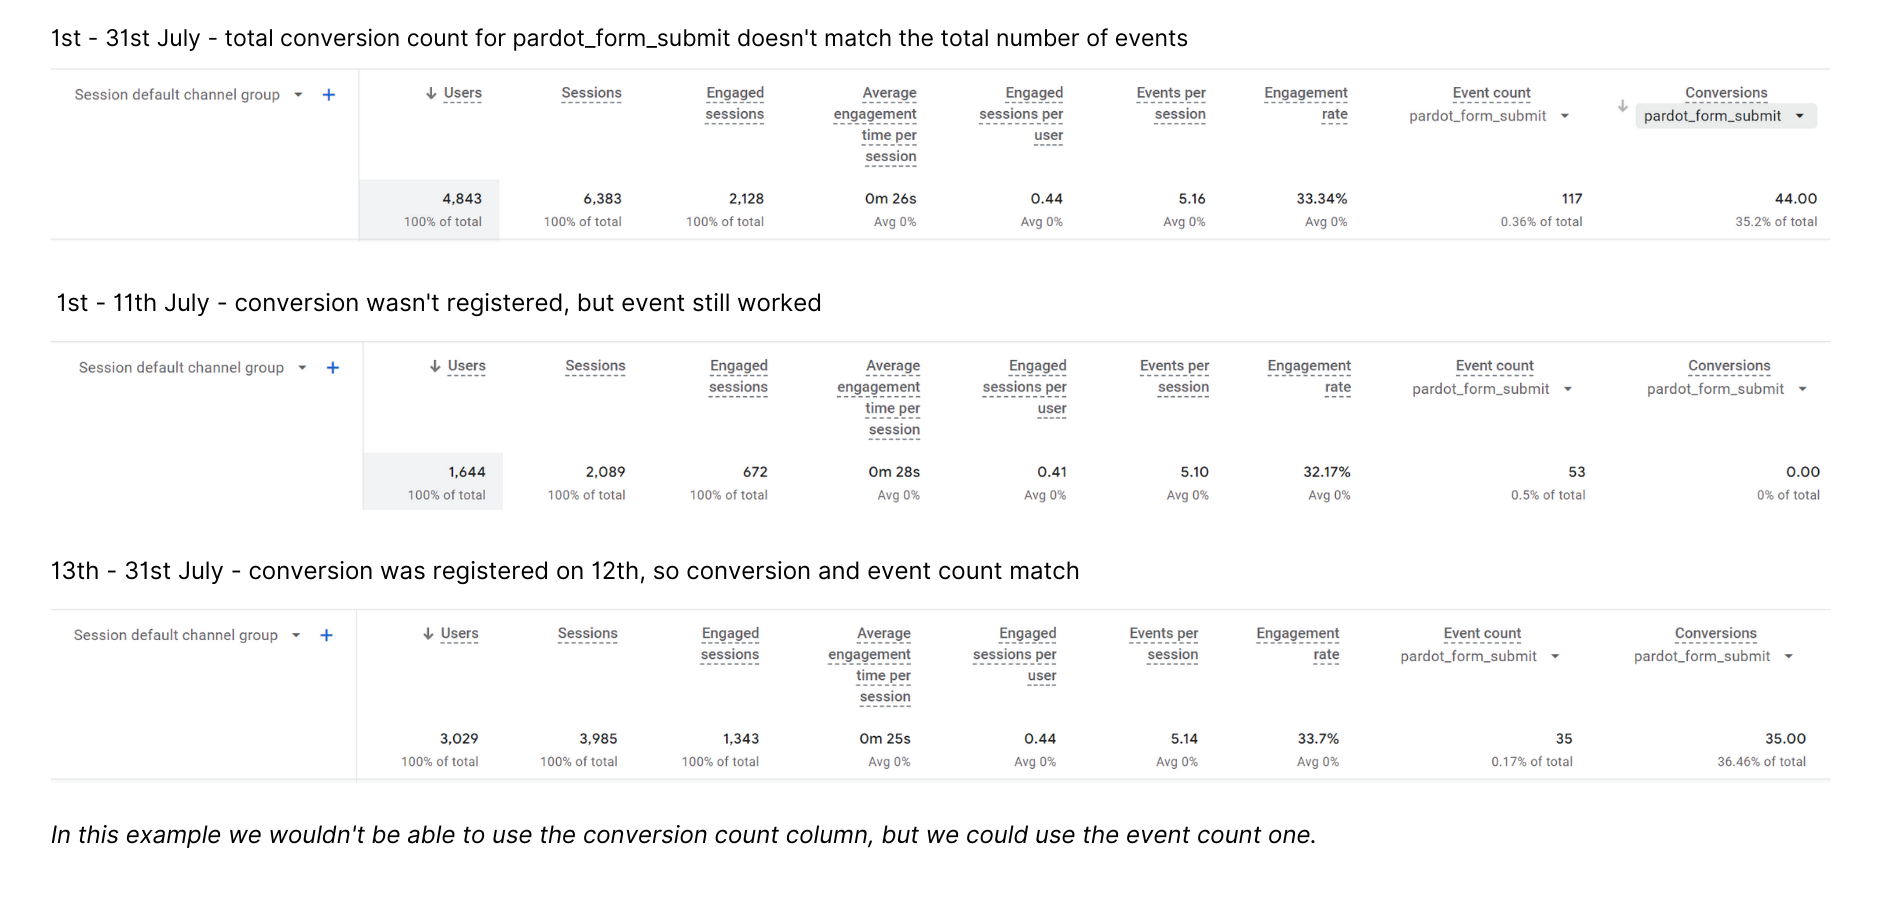
What I mean by this is if you’re counting any event name as a conversion, then this data will only show up in the conversion column and attribution reports from the date you activated it as a conversion.
Since conversions are based on events, you may be in a situation where the event has counted hits prior to you converting the event into a conversion. If this is the case, you might find in a particular date range, that the event count for an event name differs from the conversion count.
Best practice to ensure you don’t miss out on counting conversions is to register them in the conversion admin section as soon as you know you’ll need to count it, rather than waiting for it to appear in the event list to toggle it on.
But remember the point above about spaces in event names - if you’re using them, then you won’t be able to do this proactive approach and you will have to wait for them to appear in the list.
The GA4 UI doesn’t actually tell you definitively how many users visited your website
Brilliantly explained by Charles Farina in his article The Traffic Source Challenge in GA4, the ability to use a traffic report to answer a simple question like ‘how many people visit my website?’ is far from straightforward.
There are three reports which can give user statistics but they all give a different view, and a different data count for the total.
User acquisition report: will only show you the very first traffic source for each visitor. This will tell you how many users first visited the website from a source but not how many total visitors came from the source.
Traffic acquisition report: this report shows you the first traffic source of each individual session (so unlike the user acquisition one it will count multiple sessions per user and assign credit to different sources).
However what constitutes a session is where the confusion arises.
- GA4 no longer splits out sessions by a change in source during a user’s browsing behaviour. UA did. In UA, the same user with a new traffic source would end the current session and start a new one. But GA4 doesn’t do this.
- A new session is initiated when a user views a page or screen, or opens your app, and there is no session currently active. A session will end after 30 minutes of user inactivity, but there is no limit on how long a session can last. Note that session timeout can be adjusted if you want to increase or decrease the sensitivity of what constitutes a new session.
- If multiple sources contribute to a single (long) session then only the first source will be reported in this report. E.g. if someone clicks a paid ad, leaves the site and comes back on an organic search result and the session was seen as ‘active’ then paid ad retains the session credit and organic search’s contribution isn’t visible.
Conversion report: this will attribute credit to all sources during a conversion journey, however, the universe of users is only against those who have converted. E.g. you can’t analyse conversion rate as you would be missing all the people who hadn’t converted in the calculation.
Charles sums up his article by suggesting that BigQuery is the only answer right now to help ensure sessions with multiple traffic sources are properly accounted for basic user/session reporting. Oh joy!
Changing date ranges can change report views & data counts (in unexpected ways)
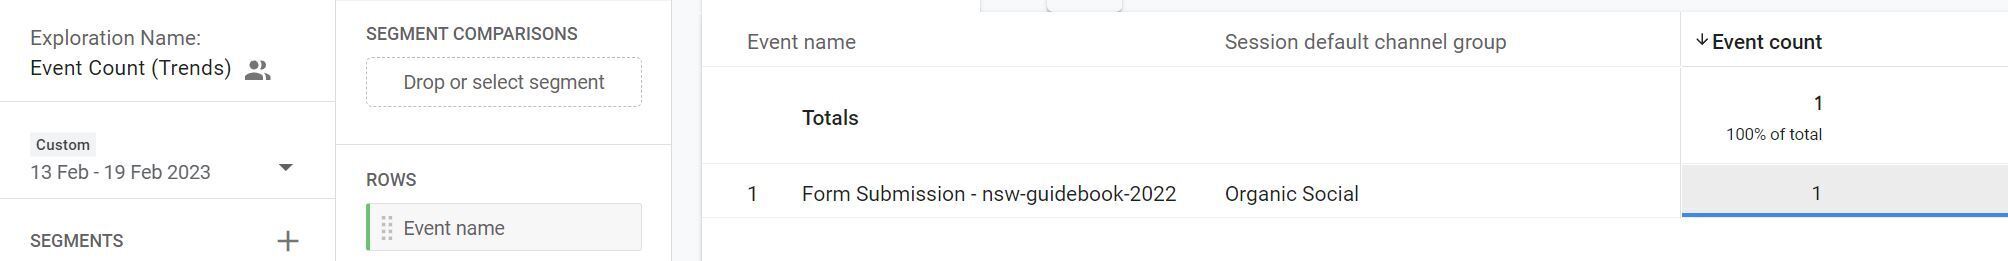
Returning to a previous example, when trying to get a steer on how popular a form fill was I looked at two different date ranges. One was 1 Jul - 25 Jul, the other was 1 Jan - 25 Jul.
Before even showing you the results, you’d think that output for 1 Jan - 25 Jul would be the same or greater than 1 - 25 Jul…
Well… in this example the event count matches up, but the numbers reported by week differ
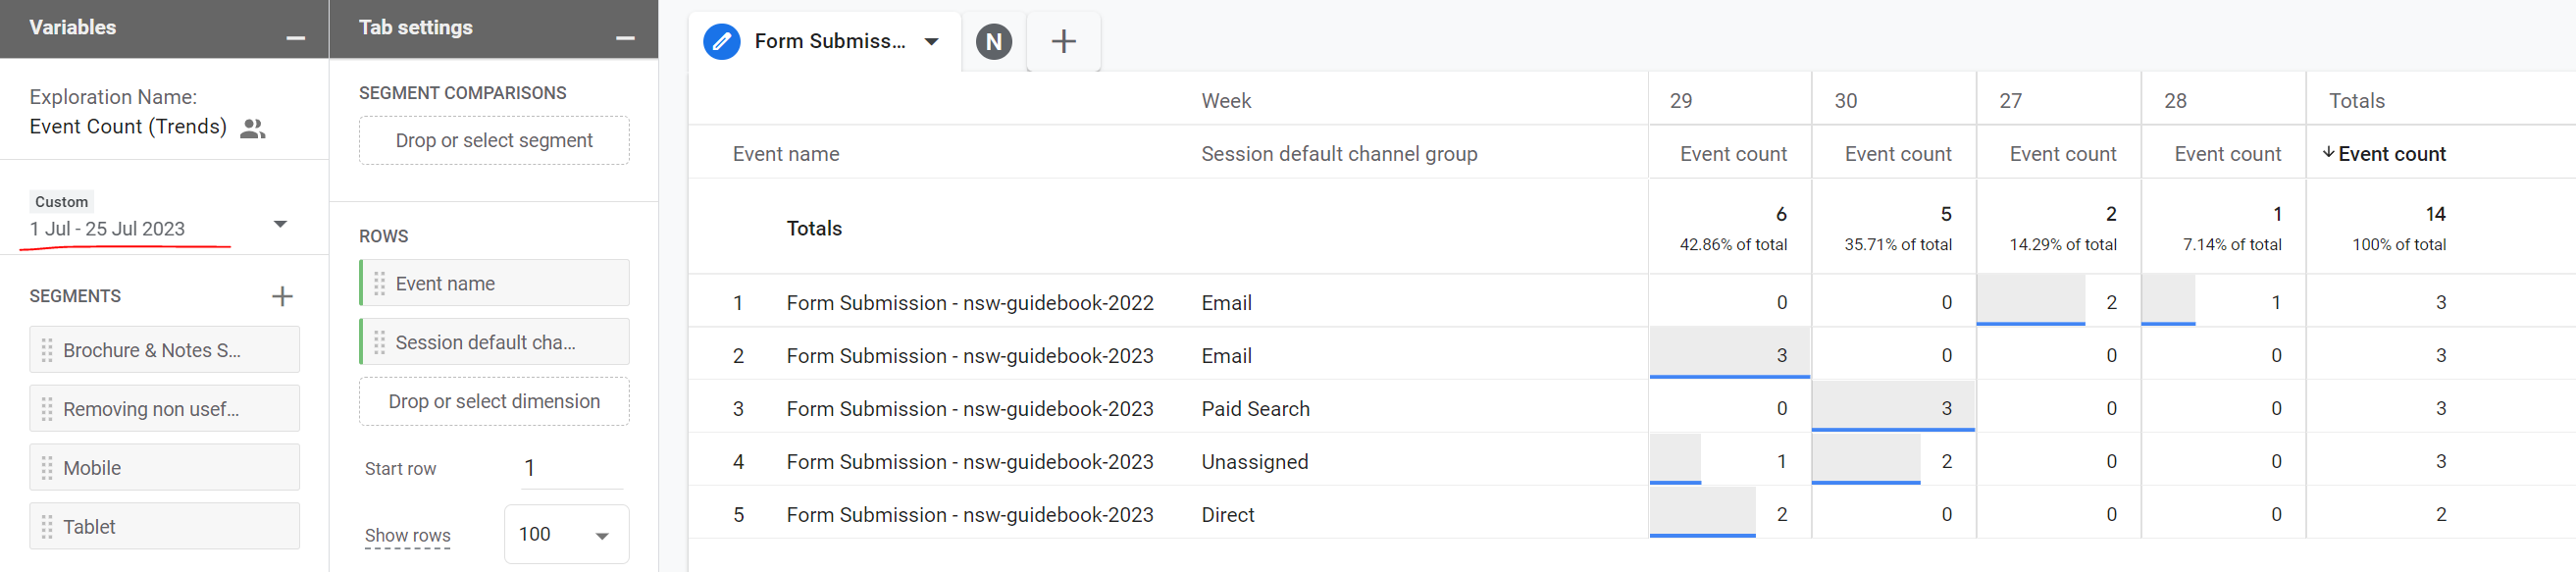
vs.

Note: The data for the longer date range is also heavily sampled, only offering 16% of available data.
If I narrow my data to week 7 only, when I would expect ‘7’ for organic social, I only see 1 event count. Why oh why?
At this moment in time we don’t have an explanation for why this is occurring but it’s likely to be down to thresholding, attribution and processing rules.
We’ve also noticed session counts may change when adding a secondary dimension to standard reports.
For now, being consistent with your approach will be the most reliable, and spotting patterns in the data rather than trying to get the true answer will (hopefully) keep you sane.
Don't check your results too early
Remember...
Google Analytics allows for a data processing delay of 24-48 hours. During that time, data may change, so reports may not be consistent when viewing the last 24-48 hours in an account
This was recently experienced by a client who viewed yesterday's results in the traffic acquisition report only to be greeted by a lot of direct, and unassigned traffic source data rather than search. This sparked a panic, despite being aware that nothing had changed on the website nor in the tracking code to cause the data to react in this way. The day prior had been fine.
Fast forward to a day later, and the results from that previous 'yesterday' returned to normal with sessions reported to the, as expected, channel sources. No changes had been made to the website or the tracking set-up to trigger this big shift in attribution of session credit.
Moral of the story, they looked at performance too early and Google had not processed all the information in time. Unfortunately there is no being impatient with GA4 data.
To circle back to the opening quote from Charles Farina, there is still a lot to understand about how GA4 works, which in part is due to how you’ve configured your property and set your consent rules, but is also in part to how GA4 processes data and displays the numbers to you. Still so much to learn, and unfortunately for us all, it’s not as straightforward as the world of Universal Analytics, but hopefully it becomes more accurate.