Blog content is a fundamental component of SEO. But with all the effort that is put into creating blog content, is it really worth it?
Blogs are a critical part of on-page optimisation strategy, embarked upon to improve internal links, keep the website fresh (so search engine spiders keep crawling & favouring the site) and to demonstrate E-E-A-T for better organic rankings. It can also deliver additional website traffic in its own right, if it ranks well.
However, measuring blog traffic through to purchase has been notoriously difficult with Google’s Universal Analytics (especially when a blog sits on a different domain and/or a different UA property). All that time invested in planning, creating and uploading content can go unappreciated if there are no tangible sales to attribute to it.
So, with the arrival of GA4 we wanted to show how measurement and evaluation can be done!
The current blog measurement situation
The reality is that many blog visitors are engaging with your business for the first time, or maybe regular visitors lean on your blog for information on an ongoing basis, but rarely does their engagement lead to a direct click through to a product or ticket purchase.
And even when it does, if your blog sits on a different domain or has a different UA property ID, stitching together landing on a blog through to purchase has been littered with problems. Sound familiar?
Landing page reports don’t usually attribute transactions to blog content (because of the user behaviour explained above) [example 1]; and purchase events can’t be aligned with page path reports because a purchase event is connected only to the page that the purchase occurred on (e.g. a checkout confirmation page) [example 2].
So what do you do?
Example 1: Landing page report: no transactions from blog pages
Example 2: Page path report: transactions only attributed to /checkout/complete page
GA4 measurement solution(s)
Your journey will start in the Explore section of GA4.
There are a number of reports you can create which will give you different ways to understand user behaviour and apportion credit.
First things first, hopefully your GA4 property is tracking across your website domain and any subdomain, so that cross domain tracking (one of the key features of GA4) is activated.
Report type 1: Free-form tables
In order to understand which blogs (if any) convert into a customer, you will need to create an audience segment that applies these conditions to the universe.
In the segment section (or the explore report panel), create a user segment with the following conditions:
- include users when: purchase (this means the purchase tag has to have fired)
AND
- include users when page_view is filtered by a blog characteristic* (e.g. hostname contains blog, page_location contains blog, content grouping contains blog). *This condition will vary on your tracking set-up
Plus
- condition scoping = across all sessions (interact with the ‘people’ icon to see alternatives for ‘within same session’ or ‘within same event’).
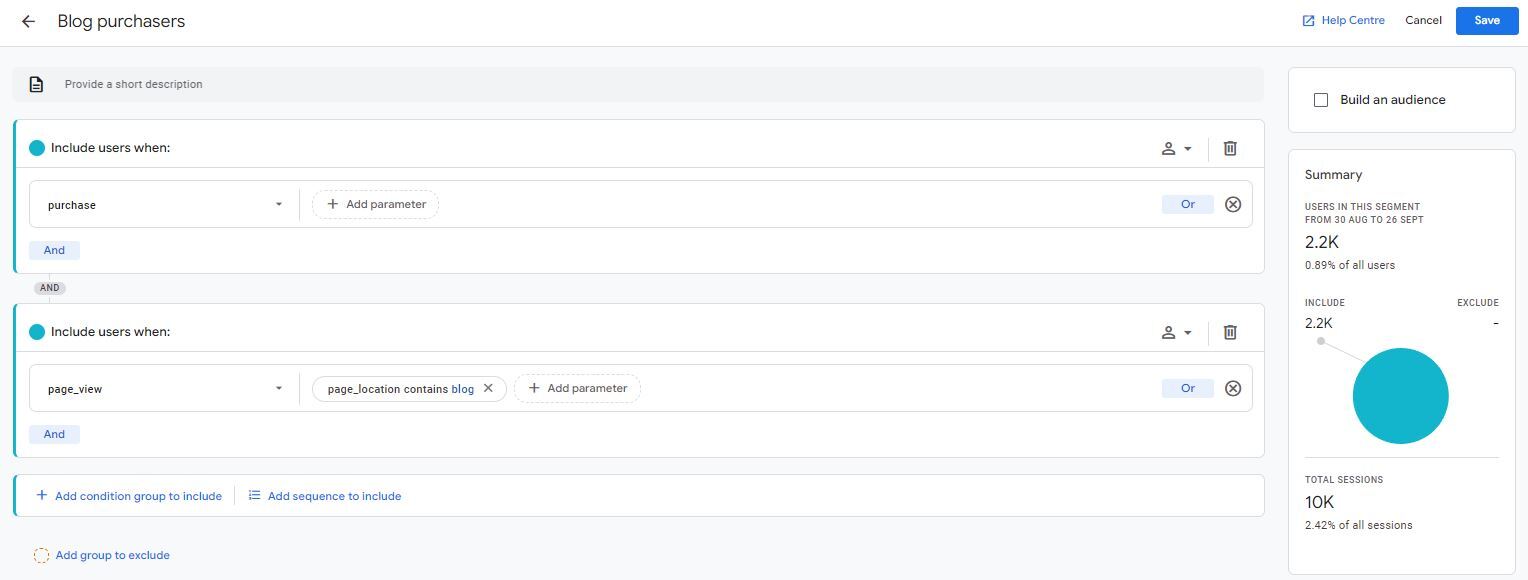
This user group will include anyone who has converted AND visited your blog regardless of which session either of these two actions occurred. The sequence of events also doesn’t matter.
If you need to understand blog through to purchase behaviour within a single session, then change the condition scoping to ‘within the same session’ or if you need to evaluate the sequence of events, you could change the include users condition into a sequence rather than a series of include conditions.
Like this…
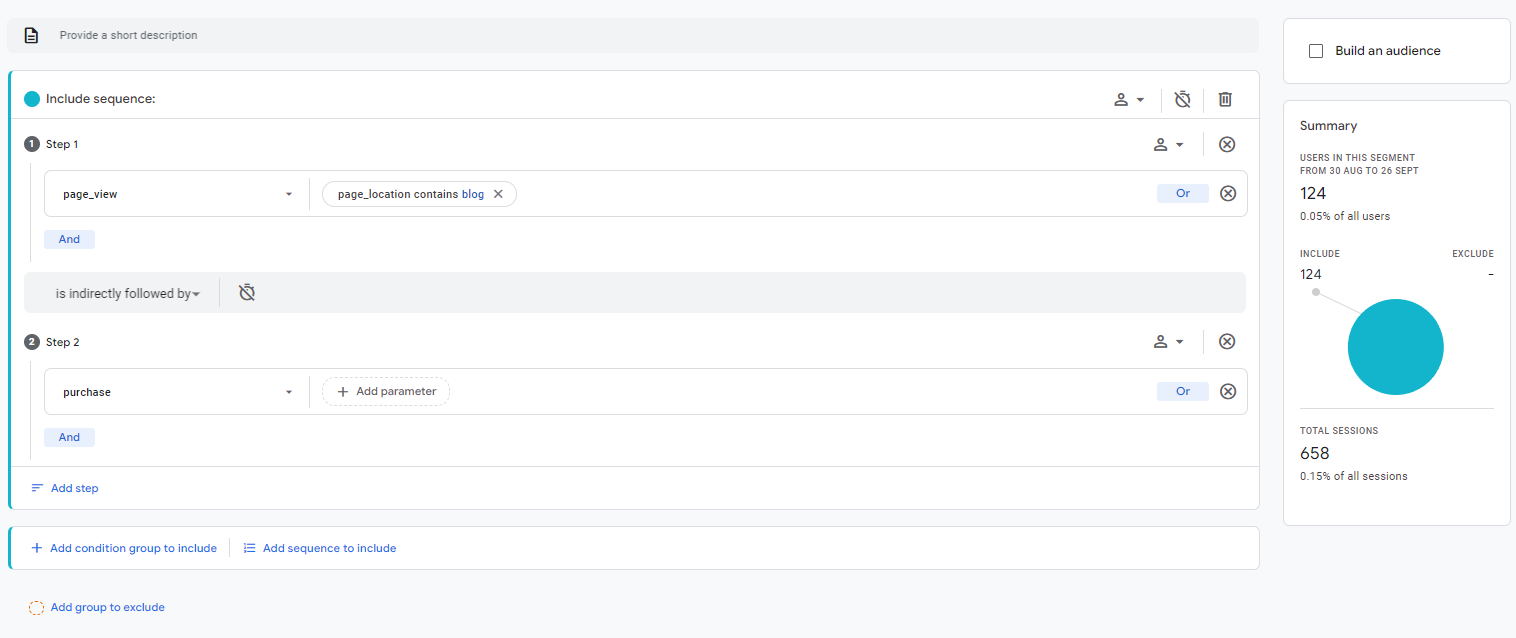
In this example, we only want to evaluate people who have viewed the blog prior to purchase. Alternatively we could have analysed people who viewed a blog after purchase and understood its role in post sales behaviour. More on that later…
Now to put this audience into a report…
You’ll either want to be viewing the blog traffic holistically, or at a page level, so it may be worth having two reports
The first one will be for ALL blog traffic - create a report that combines
- the dimension: event name ‘purchase’,
- with metric: event count
Then add segments (as columns) for your total users vs. blog purchasers so you can sanity check the difference between the two audience groups.
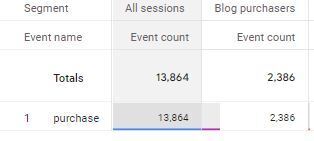
^ What this data tells us is that of the 13,864 purchases, 2,386 came from users who also visited the blog in the same time period.
This data can also be viewed against revenue values as well.
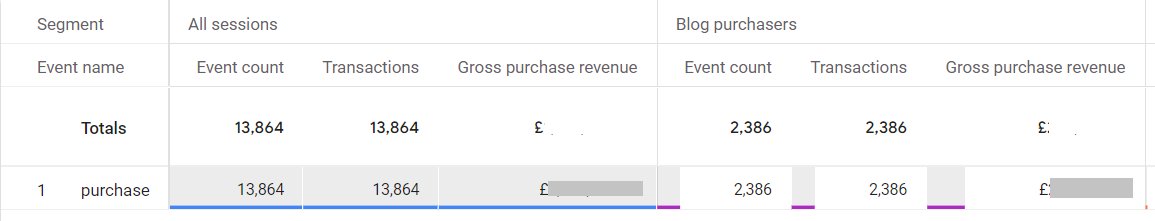
To calculate the ROI you would need to determine how much time was invested into creating the content (this may be the contract value of a retainer with an SEO agency) or an internal cost or both! Take the (total revenue - costs)/costs = ROI.
The second report should look to find out which blog pages are visited by the most purchasers.
In this view, the data is not distinct, so a single user can visit more than one blog page and thus show up as an active user on more than one page (so don’t total the page level active user data).
For this view, you would need to select,
- dimension: page path and screen class,
- swap metric: event count for active users.
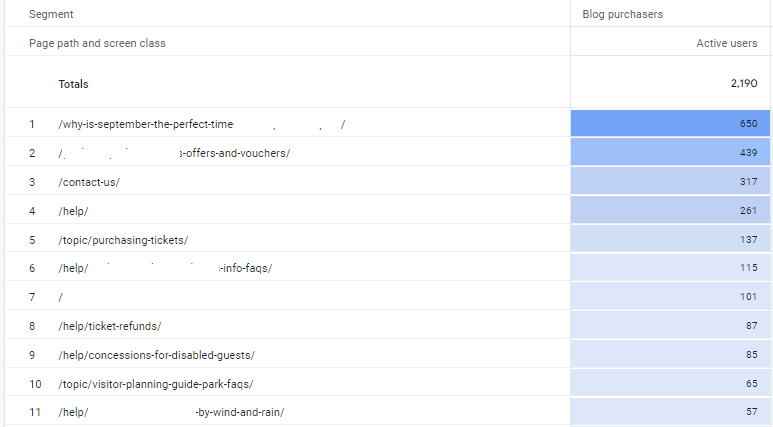
This sort of data would be able to reveal which pages have been visited by people who have purchased a ticket. You could also go a step further by adding a segment for all users, and calculate the % share of blog purchases vs. total users per page to work which ones over-index in popularity.
Whilst in an ideal world we would want the data count in the first report to match the data count in the second, experience has taught me that expecting to see the same totals in two reports (even though they’re based on the same data pool) is unlikely. But they’re pretty close so in this case I don’t think I’ve gone wrong with my report build.
Iterations of this report would involve evaluating whether a sequential user segment would help identify whether the blog was viewed more pre-sale or post-sale.
In the example below we wanted to know whether a specific blog series saw more visitors prior to a sale, or after it.
Using a sequential audience segment approach, we had one audience where we put step 1 as page view of blog, and step 2 as purchase, and for the other audience it was the other way around.
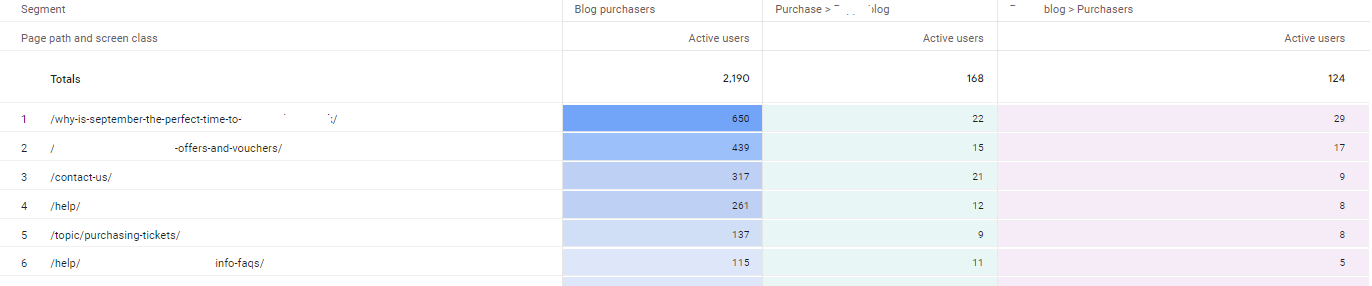
These results allow us to see that more people actually saw the blog content connected with the series after purchase than they did before. Although this varied by page.
Unfortunately due to the incompatibility of purchase metrics and pages it’s not possible to evaluate revenue per page.
If you’re keen to find out a specific page or cluster of pages’ financial worth then you could put these into an audience segment and repeat the first steps of this report build process. Alternatively you could apply an [active user] multipled by [avg. transaction AOV] calculation to estimate the revenue impact per page.
Report type 2: Funnel explorations
The free form report offers a view of individual pages and their association with a converting user. If you need to consider the user journey in more detail and want to understand drop off rates, you may benefit from a funnel exploration.
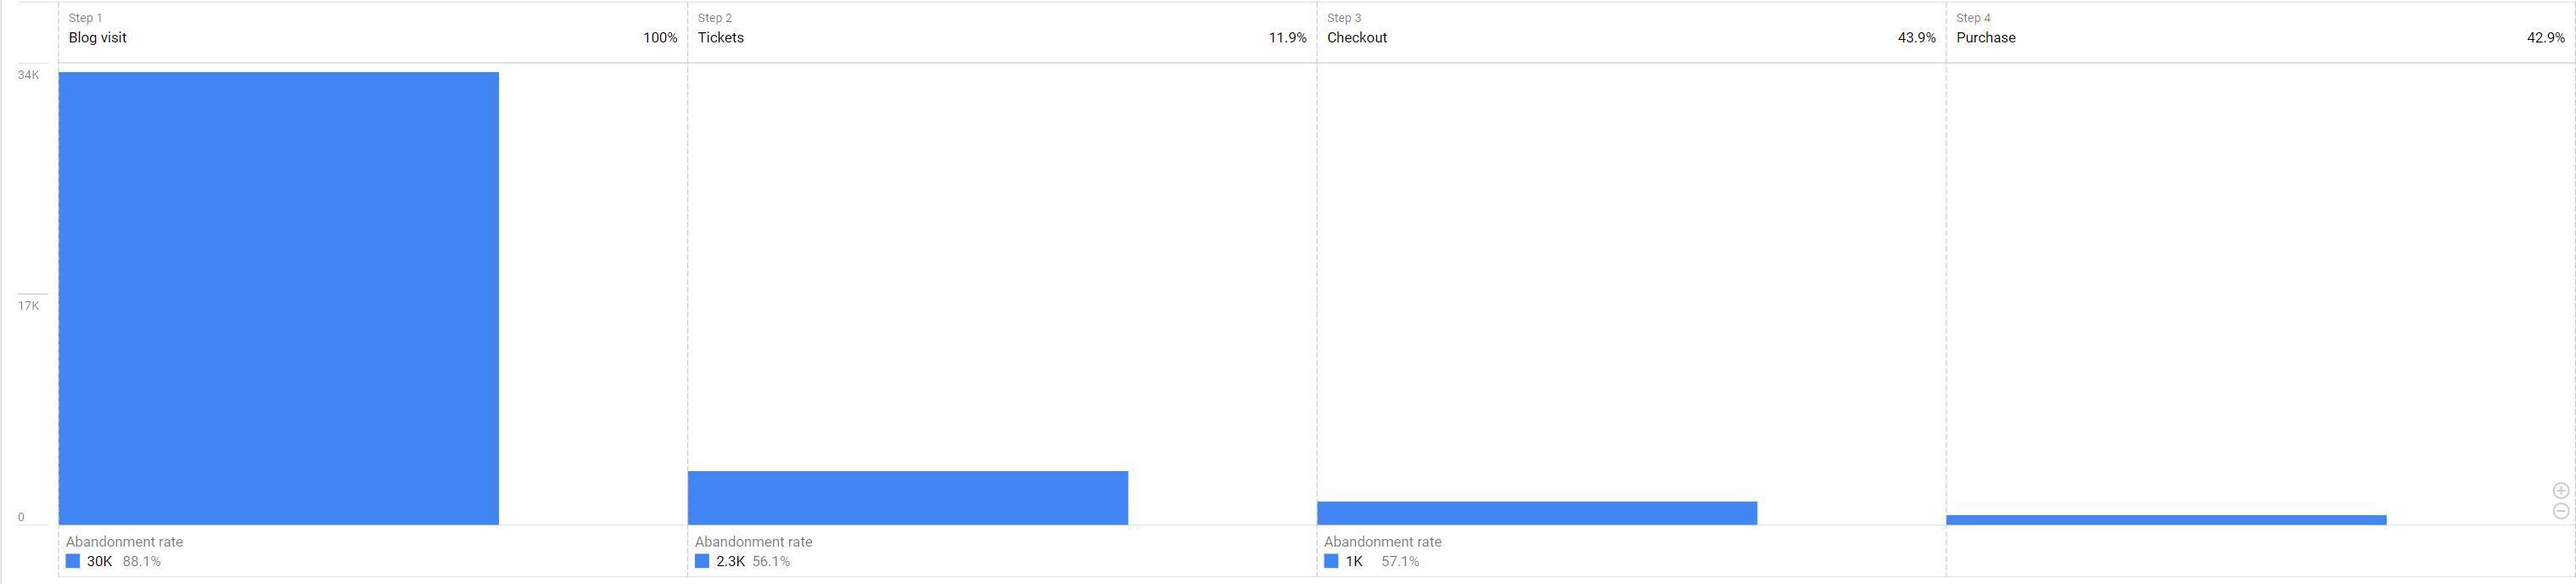
To recreate this, you would first need to create a step which contained your blog visits, and then you can either include:
- a direct correlation with a subsequent page_view which takes them to the tickets checkout flow
- an indirect condition which takes them to the tickets checkout flow
*We understand that the ‘directly followed’ condition may not be as robust as we would hope. Since everything in GA4 is an event, the ‘directly followed by’ condition means that the next proceeding event type must be the condition specified (and page_view for example may not be the next event). A workaround could be to choose 'indirectly followed by', but set a low time constraint to allow all event types on the next page load to occur (tickets) without a user diverting off to another page instead.
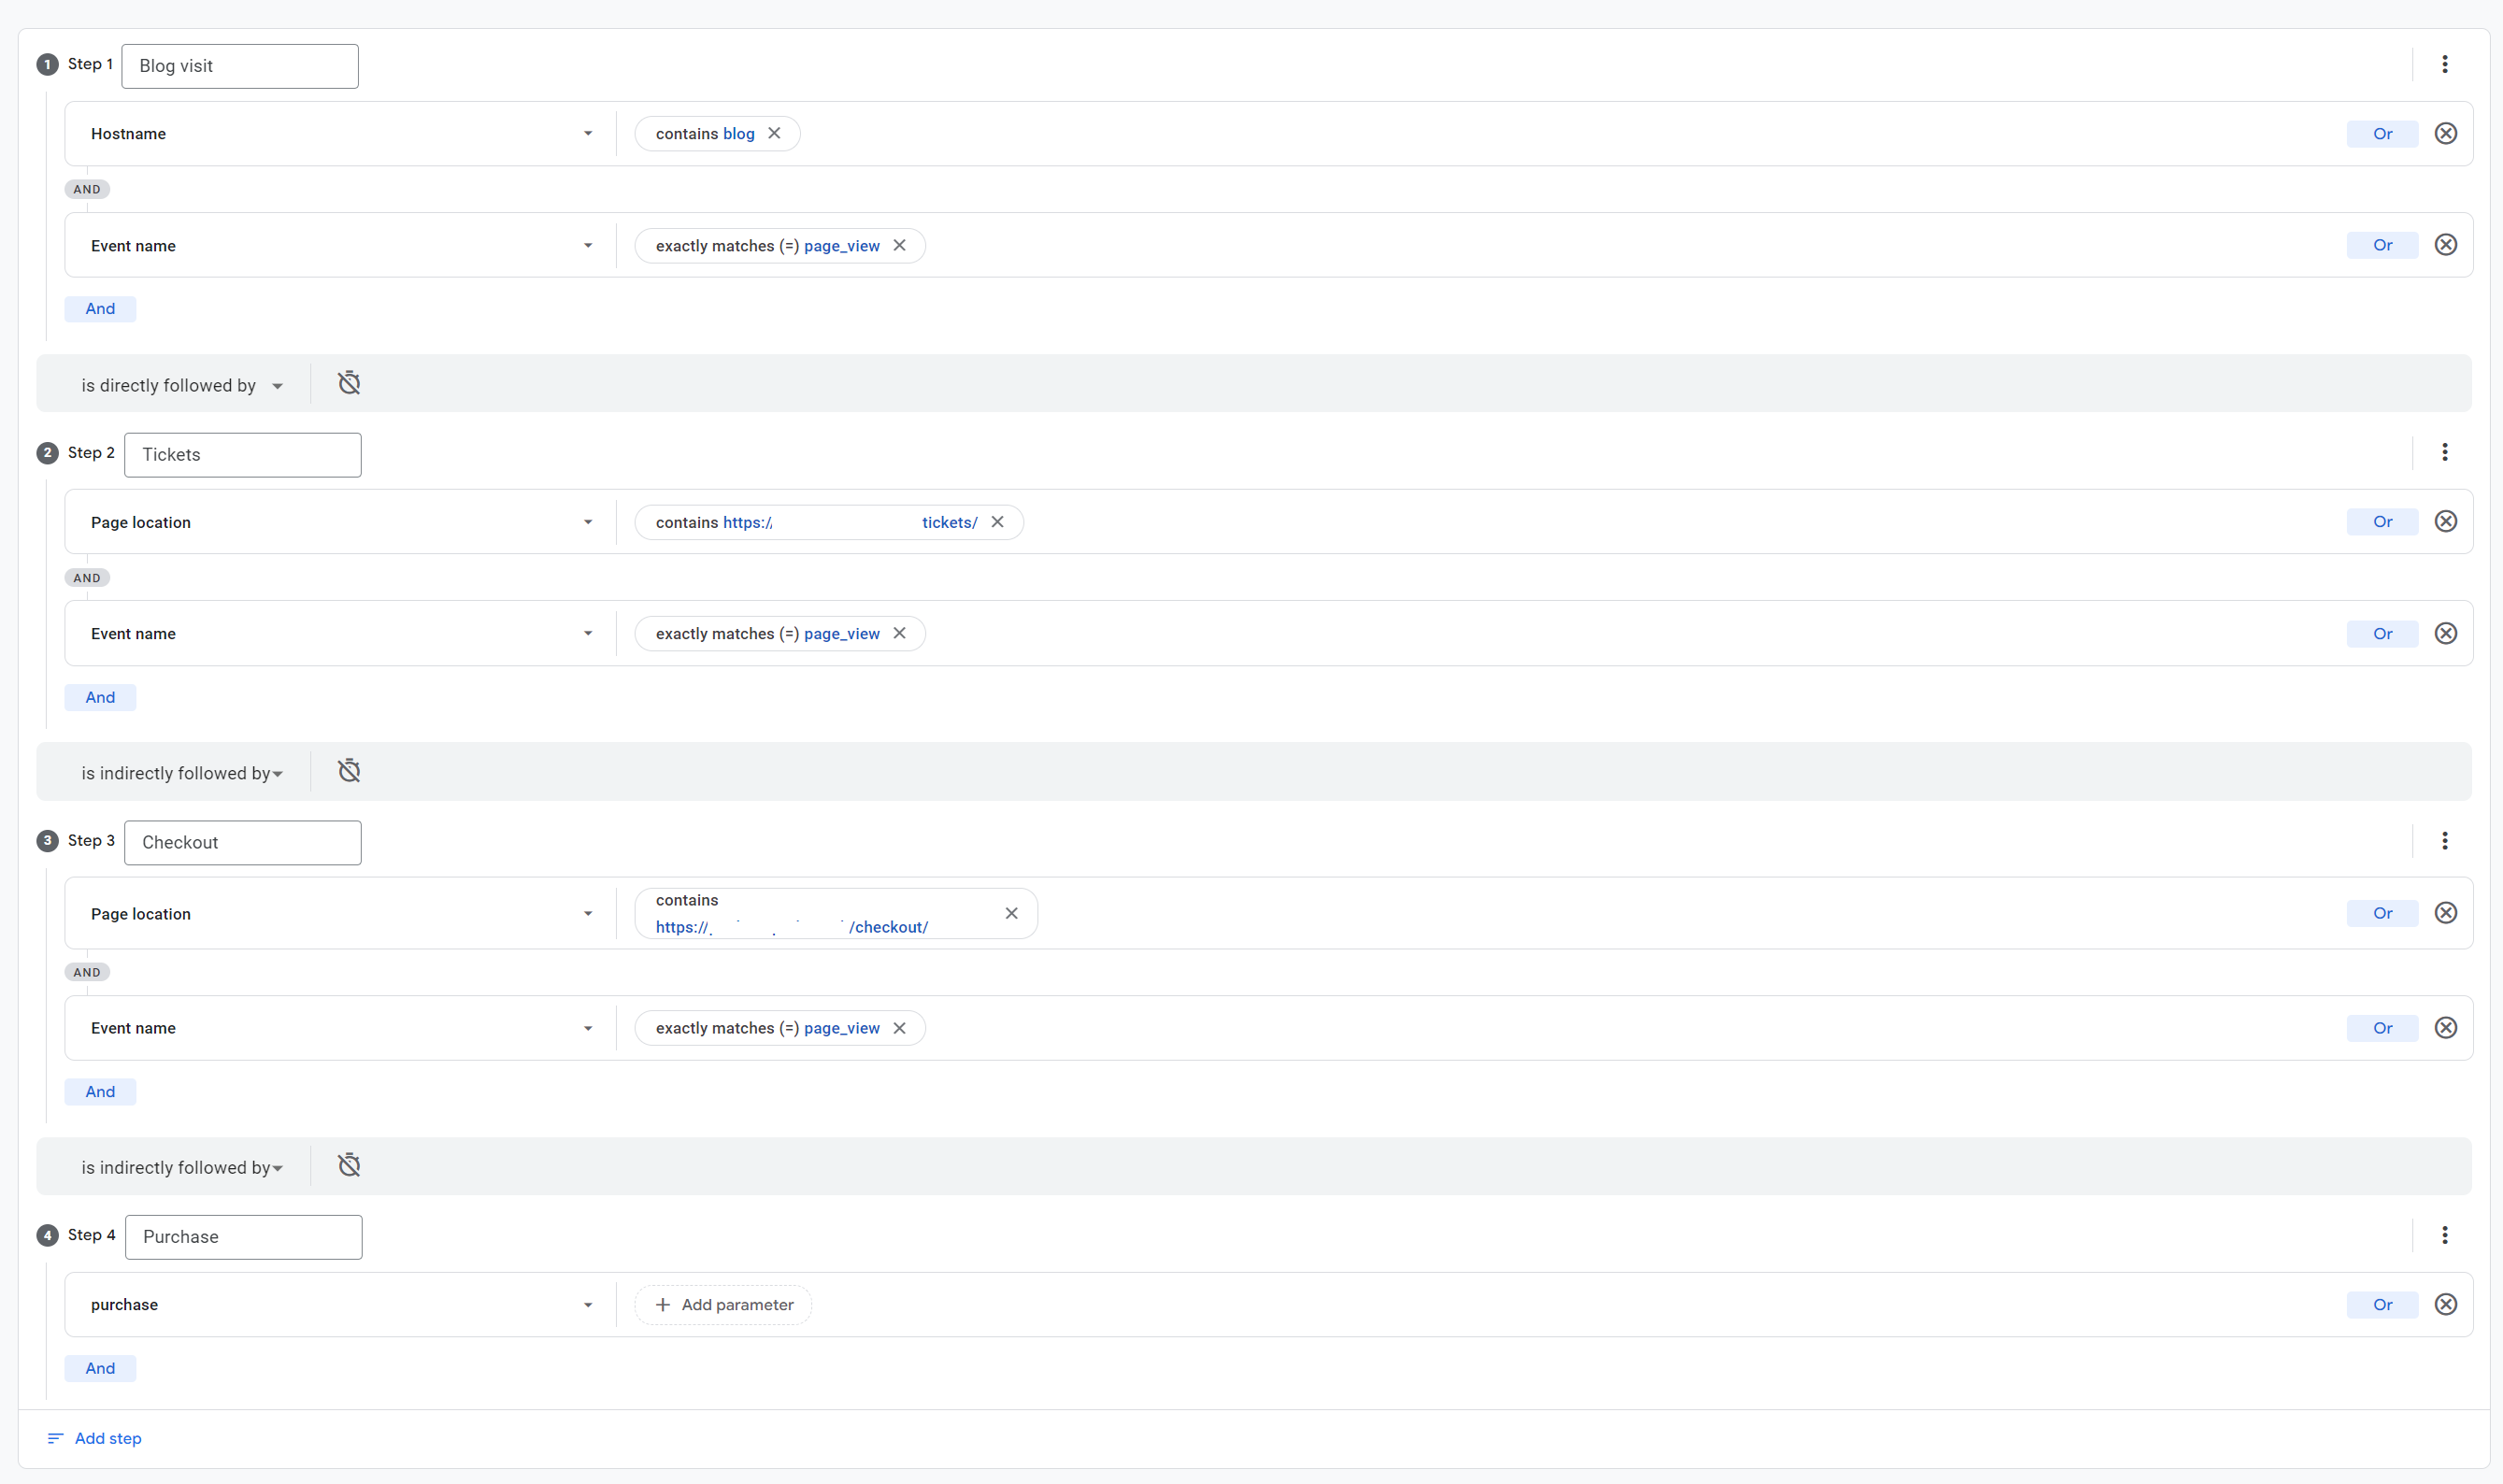
Step 1 could be adapted to narrow the filtering criteria - so like previous examples - it’s not just blog but it’s also a theme of blog, or a specific blog page.
Like the free-form table version you could also recreate this funnel step by starting with the purchase event and then proceed with blog content.
There really are quite a few options. Go on, have a play around and work through which scenarios and user behaviour understanding works best for your business and intensity of blogging. Hopefully you'll discover all that content production has been worth it!