To get ahead of the competition you need to know what they’re up to. To stay ahead you need to stay on your toes, and react quickly should things take a turn for the worse. So how do you find out such information, especially if you don’t have deep pockets to pay for enterprise level tools?
Within some of the platforms you and your agency are using every day are some invaluable ways to get an idea of what everyone else is up to. You may also find investing in some additional (reasonably priced) third party applications could aid your marketing decision making.
So here is a flavour of what you can find out and where:
What’s everyone else doing in paid ads, and how does this affect my ads?
Google Ads and Microsoft Ads auction insights
For those running paid search campaigns, you can deduce a lot about what the competition is up to with the help of the auction insight report - this is available in both Google Ads and Microsoft Ads platforms. For any term you’re bidding against, you can discover who else is competing, how often and at what position.
Sadly the insight isn’t as good as when average position used to feature in Google Ads’ reports, but we’ve become used to the new terminology of top of page rate, and absolute top of page to gauge the position dynamics.
This is the information that is available:
- Impression share: of all eligible impressions, how often an advertiser’s ad was shown (a high % means you’ve won most impressions you’ve been eligible for)
- Overlap rate: is how often another advertiser’s ad received an impression in the same auction that your ad also received an impression (a high % indicates you’re frequently competing on the same terms)
- Position above rate: when competing in the same auction, it’s how often the other advertiser appeared above you
- Top of page rate: how often an ad was shown at the top of the page in search results (ads above the organic results)
- Abs. top of page rate: % of impressions shown in the very first ad slot
- Outranking share: how often your ad ranked higher in the auction than another advertiser’s ad, or if your ad was shown when theirs was not.

With all this information you can start to form a picture of what others are up to. By viewing data over a period of time, segmenting by day/week/month, and comparing your own metrics like CTR and CPCs to this data set you can understand some of the cause/effect relationships.
In our monthly reports we like to show our clients how their performance has been impacted by other advertisers’ activity, it is an auction after all. Often CPC price hikes are due to an aggressive competitive surge demonstrated by an increase in impression share, and top of page rate or abs. top of page rate % gains from another advertiser.

Ideally you should view your auction insight reports by account, campaign, ad group and keyword level to get deep insight into what others are doing within your approach. Be mindful that this intelligence is only available when your ads are live, and for the terms you are proactively targeting. You can’t find out what others are doing when you're not active in PPC ads on the same terms.
Who are the movers and shakers in search, and how does my approach compare?
SEMRush
This is a paid subscription platform, but plans can start as low as $100 p/mth. A free version is available but the data is limited.
SEMRush offers intelligence into organic rankings for you and other businesses; it guestimates traffic levels to any domain so you can compare your volumes to others; it can reveal search terms that others are ranking for that may be worth you considering; and it offers an indication of what other advertisers are spending on search and what terms they’re advertising against.
So for a small fee, you could discover a wealth of intelligence to get the upper hand or at least orientate your performance in accordance with everyone else. I would be cautious of accepting spend and traffic stats as definitive though because these tools can only estimate based on their own calculations (using rankings, avg. CTRs and publicised CPC values).
Some of my favourite charts and graphs from SEMRush
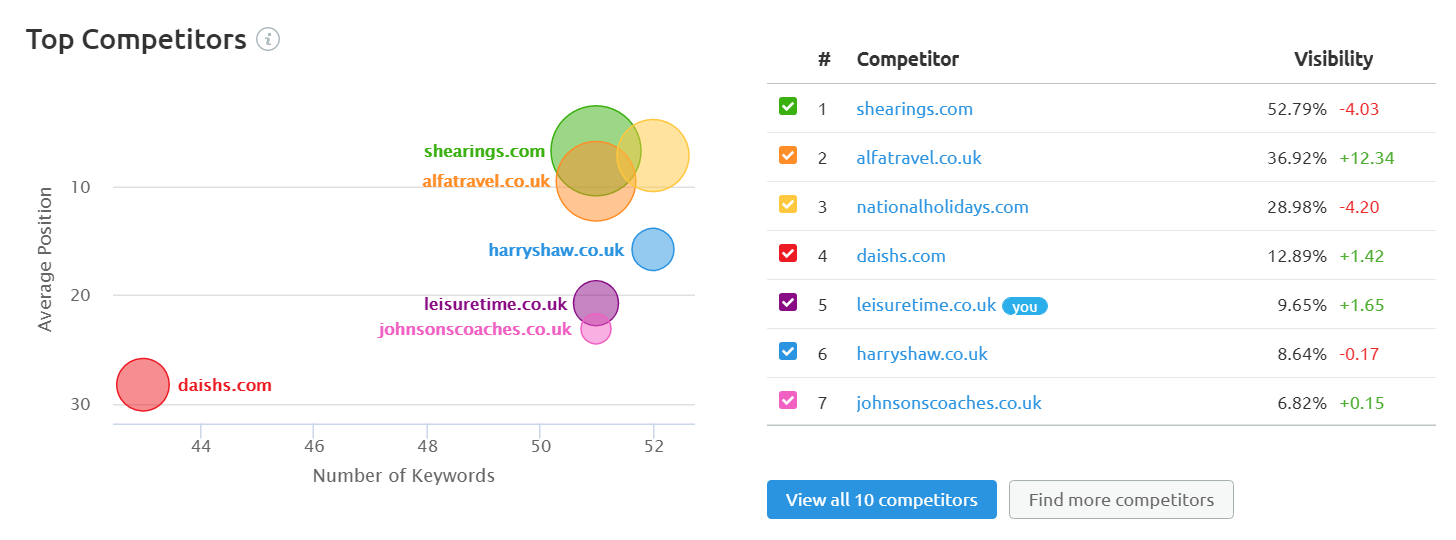
Competitor mapping
Looking at your competitor set, and the dynamics of visibility for volume of keywords which rank and average position of this keyword set. You can see whether you’re performing like everyone else, whether you’re lagging behind or leading the pack.
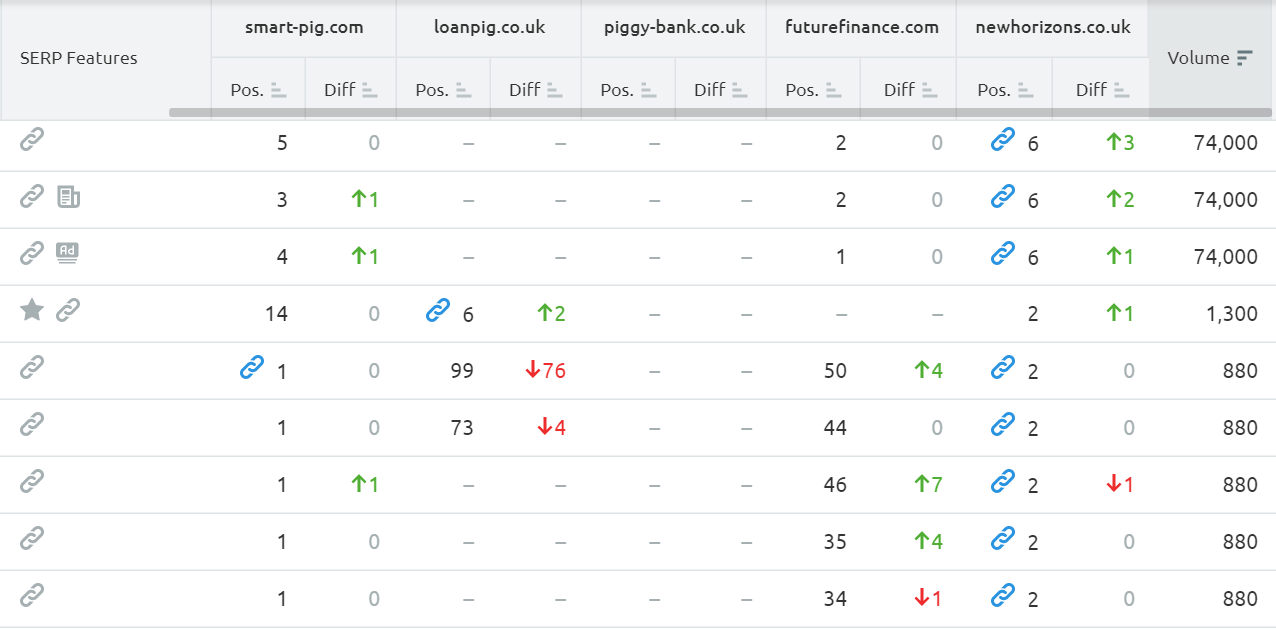
Movers and shakers
If you like nitty gritty detail you can view performance by keyword and competitor, and understand what position they’re in, whether this has changed between two dates, and also whether they have achieved any SERP features like rich snippets.
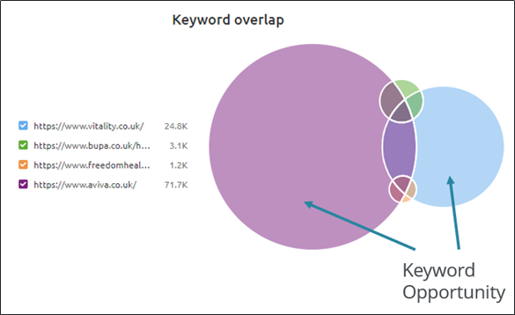
Gap analysis
Discover which keywords could hold new opportunities by learning what your competitors are ranking for that you’re not. Don’t just dive in just because they’re doing it, you’ll have to review relevancy to your business.
How can I rank in strong positions like those guys?
SEObility
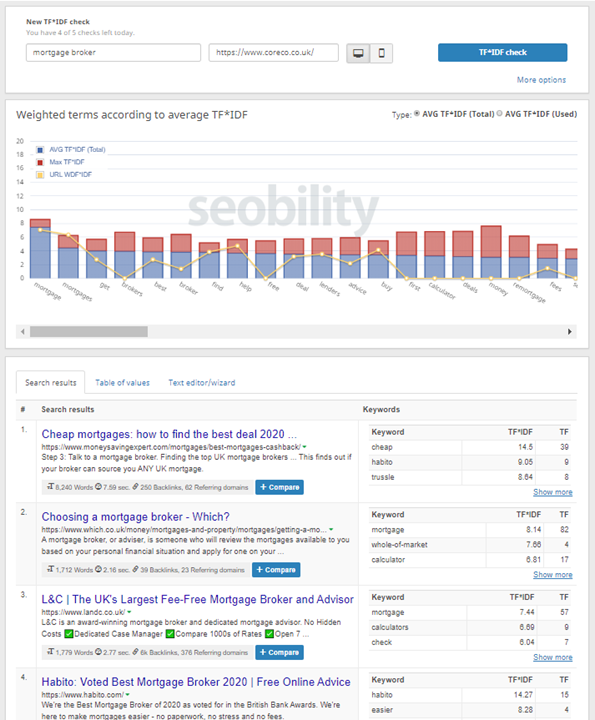
We’ve adopted a tool called seobility within our SEO strategies to understand what we need to be writing about on a webpage in order to rank on page 1.
The text analysis looks to pull out all the frequently used words within the top ten ranking pages for a certain keyword. You can also learn who is ranking for these terms and what their TF-IDF keyword profile is like.
There is always an element of human analysis here too, as competitor brand names and other irrelevant terms will often surface in this analysis, so we always ensure we only optimise for the truly relevant words.
How is the competition shaping up with regards to website performance?
PageSpeed Insights
Whilst it’s harder to get intelligence on actual website performance, there are some tools out there that let you conduct research on properties you don’t own.
We did our own desk-research recently on travel websites, looking into their page speed performance. Just because you normally use a tool like PageSpeed Insights on yuor own site, it doesn’t mean that you can't run the same diagnostics on a site you don’t own.
Tools like this allow you to find information out from any domain. So if you can commit the time to rinse and repeat the process you could build up a strong picture on how everyone else is faring.
How active are my competitors on social media?
Direct competitor benchmarking
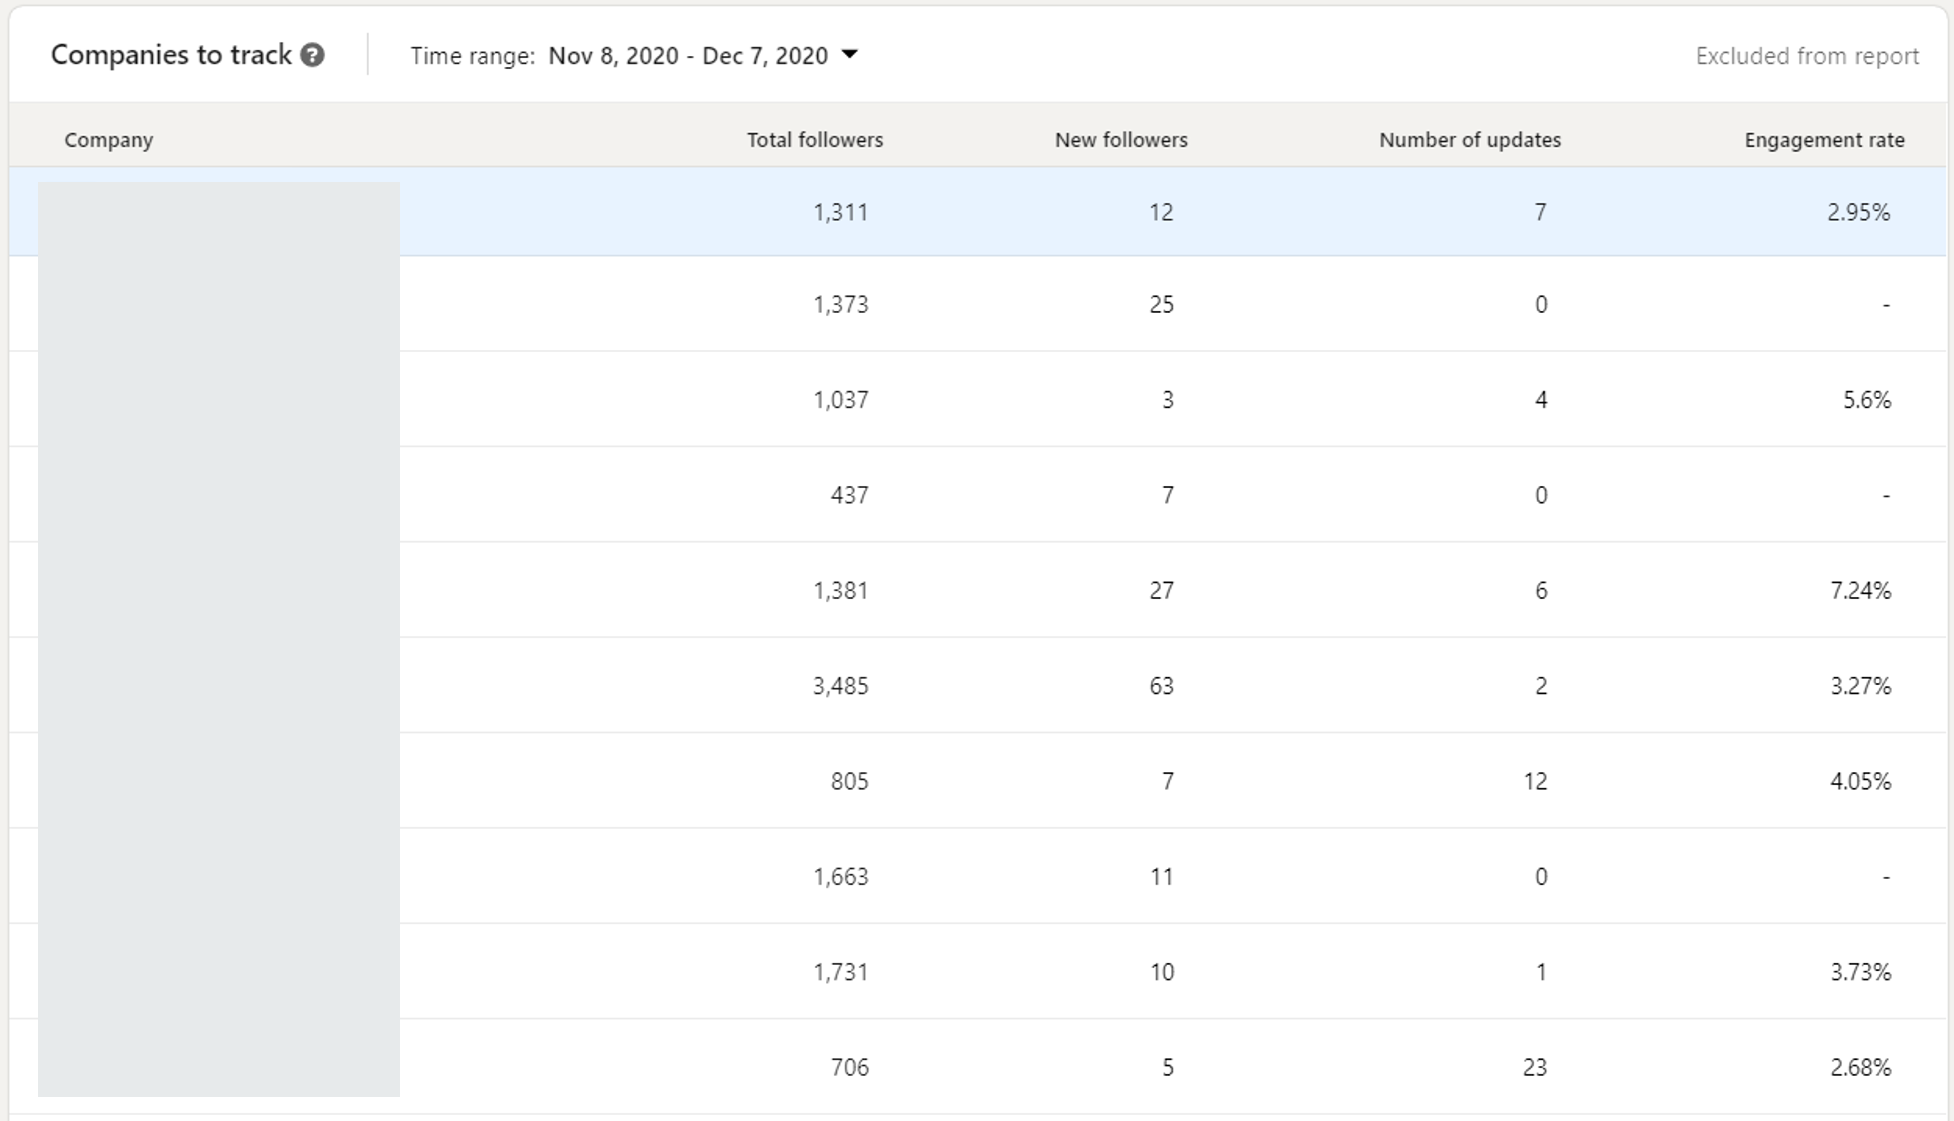
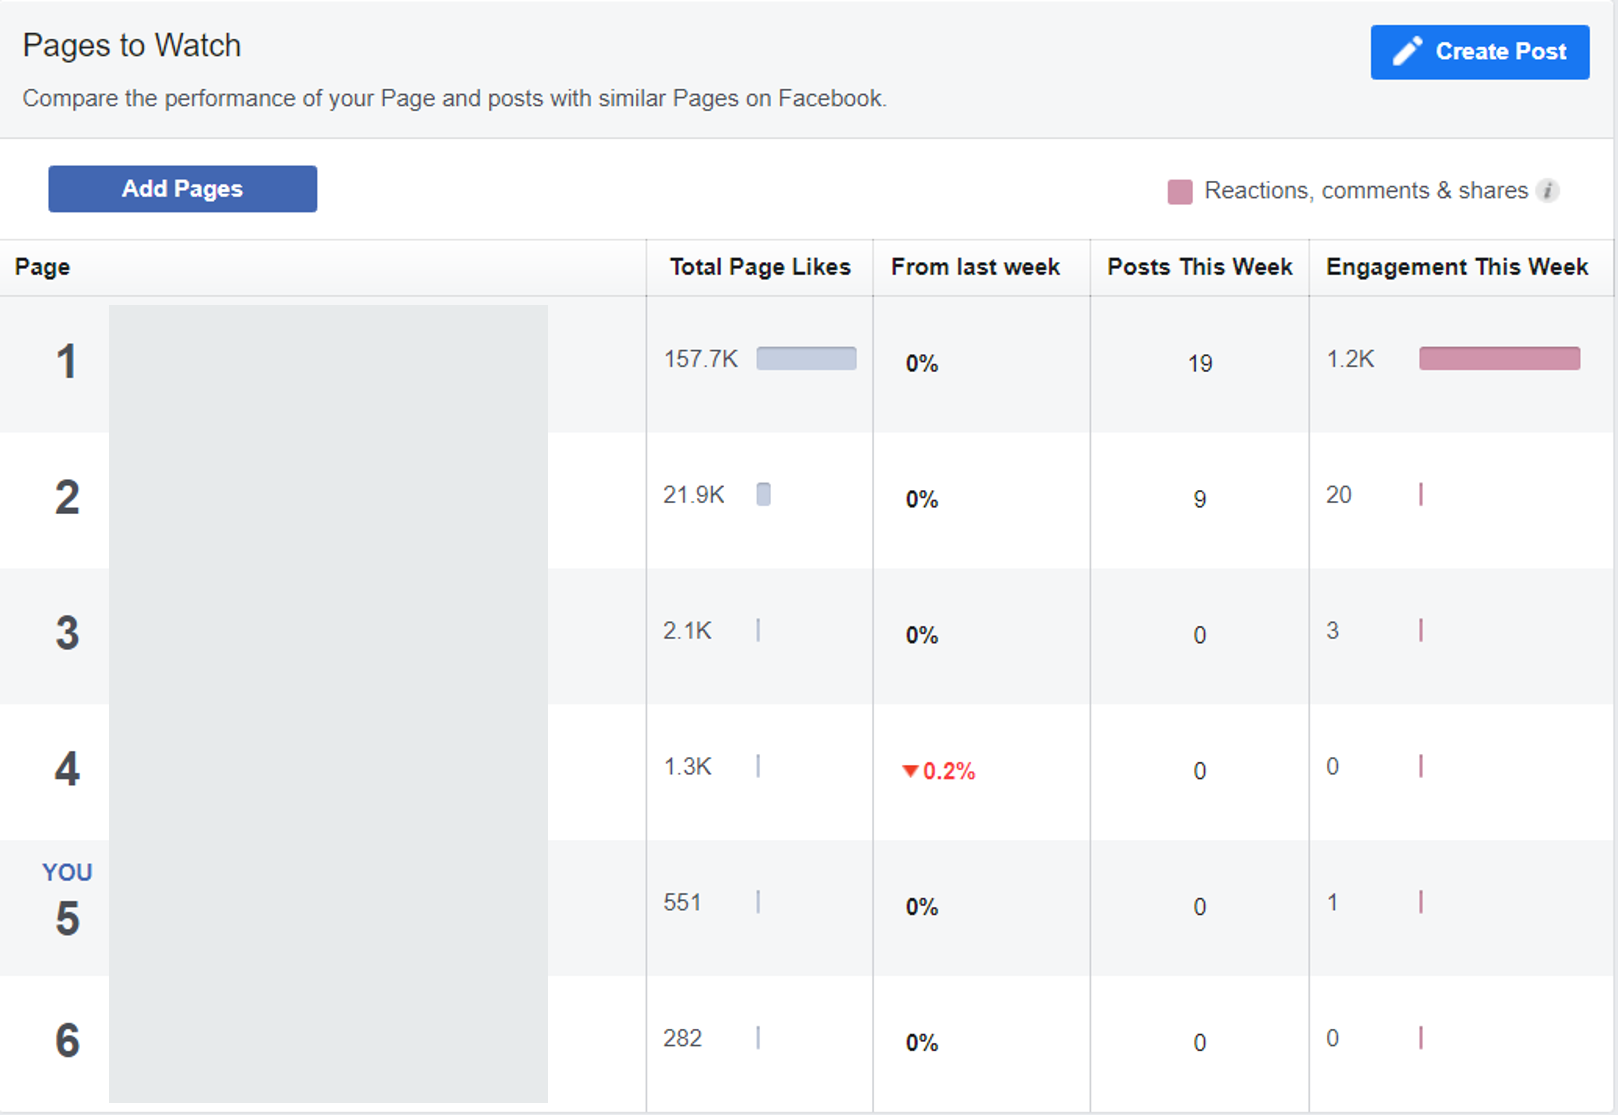
Platforms like LinkedIn and Facebook offer you ‘Pages to Watch’ (Facebook) and ‘Companies to Track’ (LinkedIn) data areas - these can be predefined by you, or you can use the wisdom of the platform to allocate those that you best align with.
You’ll get the inside track on what they’re posting, their engagement rates and follower counts.
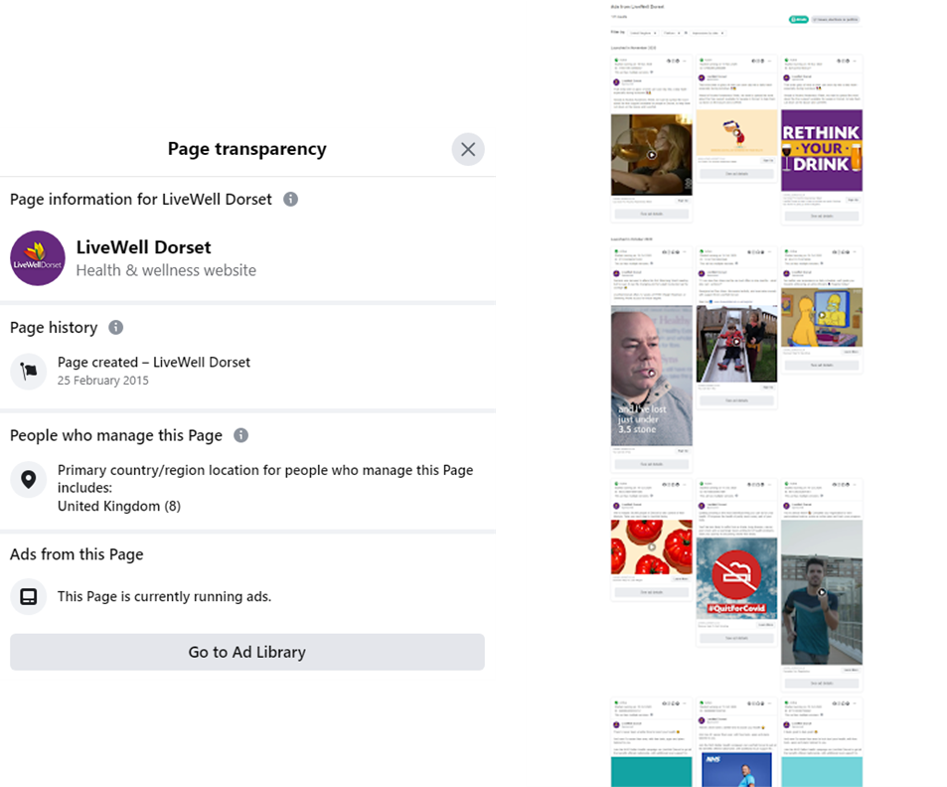
Facebook page transparency
If you’ve got some target competitors on your radar, you can review their Facebook page for ads they may be running across Facebook, Instagram, Messenger and the Audience network . Whilst you won’t get statistics, you will be able to see what they’re advertising and how many creative variations they have in-play.
Social media management/monitoring tools
There are lots of social media tools on the market which could give you further insight into what your competition is up to. From tracking brand mentions to gauging post frequency, popularity and themes. Some will also have dedicated areas, like SEMRush, to offer side-by-side comparisons on how everyone else is faring.
Social bakers has an advanced competitor analysis section and its overall platform pricing starts from £150 p/month.
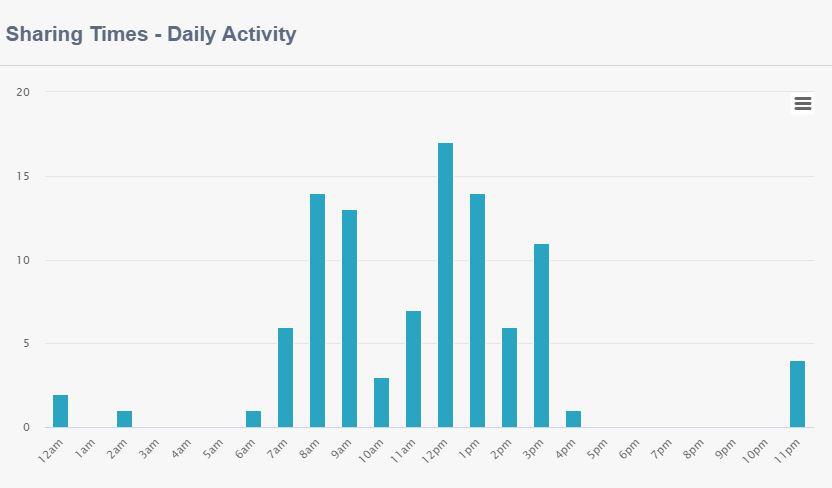
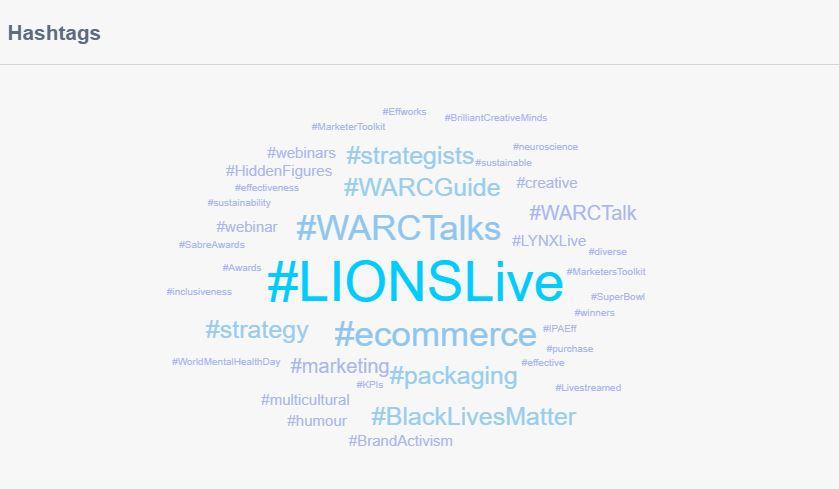
We also use SoAmpli’s industry tracker section which gives some insight into what others are doing on Twitter. Hopefully in the not too distant future this tracker will be enabled for other social platforms as well.
What share of search does my brand have?
This year the phrase 'share of search' has appeared as a potential replacement to share of voice or share of market.
A brand’s market share affects its share of search because people are more likely to want information on something they already have. And when a brand has a high share of search relative to its size, that tends to indicate that it’s about to grow.
To start to gather this type of intelligence you should head to Google Trends and use the Google Keyword tool, and run your own analysis on the volume of searches for different brands in your space.

Further musing about share of search can be found from Mark Ritson, and also take a read of Les Binet's talk to Contagious about his research into share of search as a potential predictor of share of market.
Hopefully you've found these examples useful as ways to discover what you're competitors are up to and how you shape up against them. As I mentioned at the start, there are lots of enterprise competitor intelligence tools on the market, but these tips are for those who don't yet have the budgets to invest in such detailed intelligence. I certainly believe they could add value to your business, but it's all about knowing when the right time to invest is. In the meantime, get your hands on the intelligence that doesn't cost the earth!